by Jaye Mosier October 2020
JamworksPro is engaged in all aspects of the software development life cycle. From conception to inception quality is the fundamental driving principle. JamworksPro designs and creates software solutions that are elegant, well documented and provide uncomplicated maintainability, extensibility and scalability.
JamworksPro creates software for all operating system platforms and database management systems in any environment including Cloud, Distributed and Web.
JamworksPro provides custom software solutions as well as an extensive base of software titles for Data Management as well as Educational tools. Titles currently published include
Introducing placeRvation, a Simple Space Reservation System
Introducing Math Dynamics, the Online Arithmetic Machine
Introducing Vibrology, a Fast Fourier Transform Analyis for Low Frequency Signals
Introducing The Pothole Project, designed to address our collective pothole problems
Introducing placeRvation, a Super Simple Place Reservation System
Westport Washington - October 2020
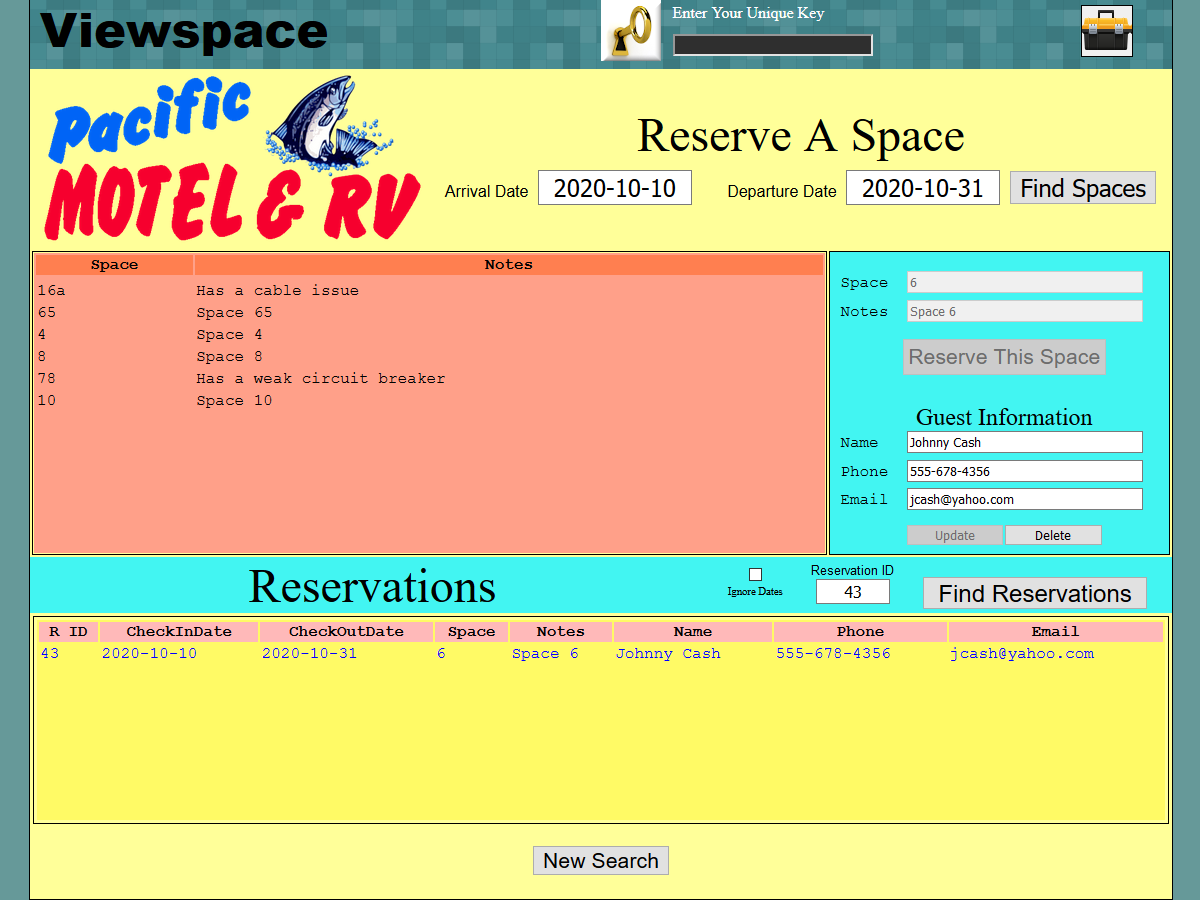
JamworksPro introduces placeRvation, a super simple place management system designed for simple applications such as RV Parks, Small Motels and Storage Facilities. placeRvation imposes order on your Reservation System.
For any date range, immediately view all facilities that are available for rent during that date range as well as all the Active Reservations for that time period.
Select a rental space, enter the Reservation details and click to confirm and enter the Reservation.
Select a Reservation to cancel it or to update the details.
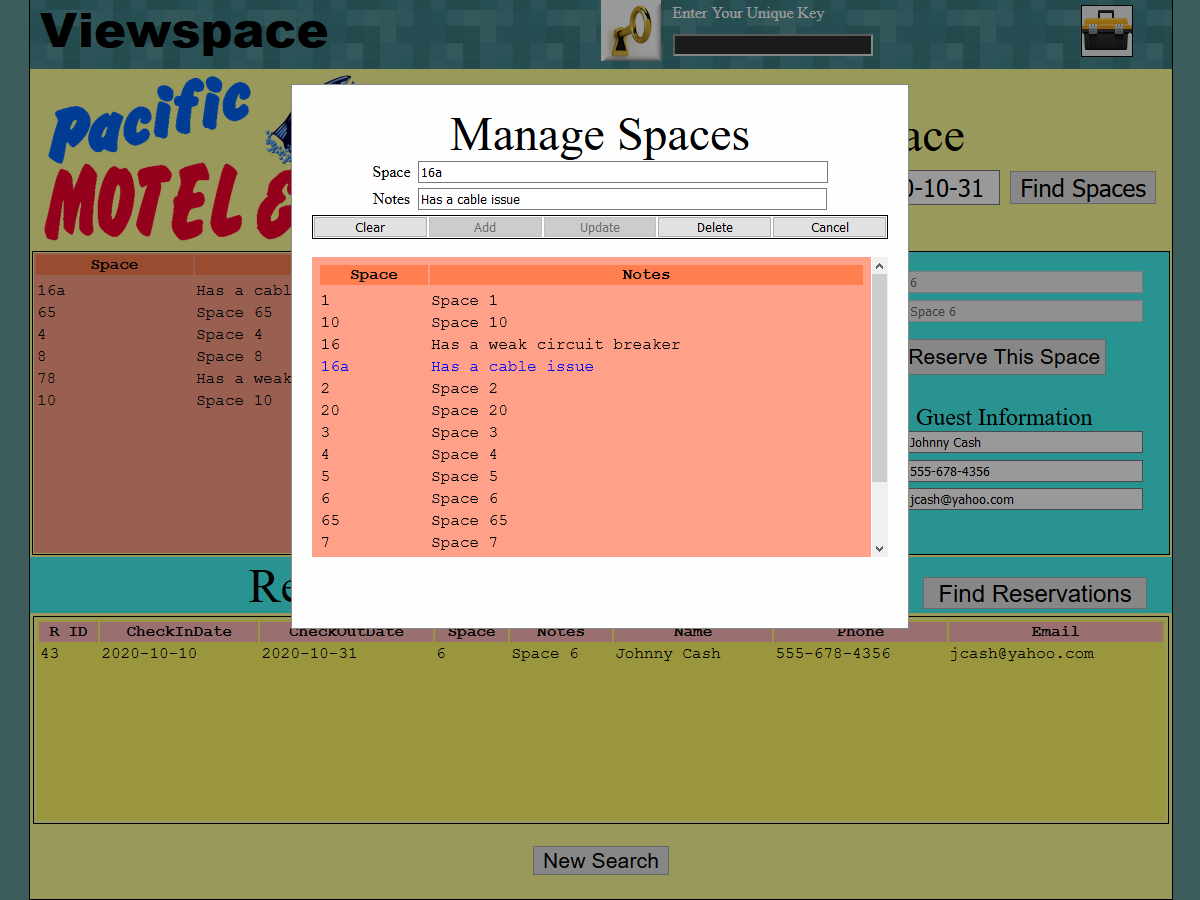
Click the Toolbox icon in the header to add, change and delete rental facilities.
Math Dynamics, the Online Arithmetic Machine. It's a platform for managing math intensive information. From simple unit conversions to advanced algebraic and trigonometric analysis. Math Dynamics allows the User to craft custom Function Definitions from many discipline's such as Statistics, Marketing, Engineering, etc...
The text is informational only and has no hard limit on its length. The text in the Title field is used as the default name for xg2 function definition files that are downloaded.
Click the browse button to select or change the selected Function Definition (.xg2) file to load.
Expressions may represent many functions from a simple constant to polynomials, logrithms, exponents, etc. From a Mathematics standpoint these Expressions, formulas, etc.. are equations where the Result represents the value of the current state of the Function Definition. (Result = Expression) where Expression is a Mathematical Function consisting of constants, variables and intrinsic functions contained as operands within a structure of Math Operators.
TIP: All the spaces in function definition are removed before interpretation by the Math Dynamics MARSHALLING ENGINE.
A number followed by a character is interpreted as follows: ('1a' = '1 a' = 1) whereas any character followed by number is interpreted
as a variable name, i.e. 'a12' or 'a 12' is a variable named a12. The Expression field is colloquial in nature and accepts most
any combination of letters, numbers and operators. The syntax is uncomplicated and in fact is the same syntax used in computer software.
All operations must be explicitly defined with an operator character, +, -, *, /, (, ).
There are some Reserved Words that represent intrinsic functions. These functions include
If there are no variables the Space will appear blank. Variables appear in the order they are encountered in the marshalling process. Each variable is represented as one row in the table. Each row identifies the variable name and its currently assigned value. As you edit the values of the variables in the table the COMPUTE ENGINE updates the Result field in real time.
TIP A Graph of the function will be generated whenever there is an independent variable defined. Independent variables have three values, separated with spaces, in their respective row in the table of variables. For example -3.14 3.14 .01 would generate and plot 628 points in the domain of -pi to +pi. In this case it would be best to set the Trig Mode to Radians.
TIP When the value portion of the variable's entry is blank, it's value is zero. Variable names must always begin with a Letter and can be any combination of Letters and Numerals. Variable names are Case Sensitive hence 1/time IS NOT the same as 1/Time.
A new result is calculated and displayed anytime the value of any of the variables are changed or the trig mode is changed
This will create and download a .xg2 file named using the Title field. The .xg2 file can then be reloaded using the Choose File and Upload Buttons. The .xg2 file can also be imported into the Math Dynamics Android App.
Its a tool for Math. Another instrument that you can add to your tool chest that gives you an edge when it comes to everyday activities that demand a quick calculation.
Use Calculator mode for a quick calculation. Calculations can range from simple arithmetic to multivariate formulas like Cost per Unit, Miles per Gallon, etc..
Function Definition Cards contain the function defintion and a list of all of the variables defined and it's evaluated result. Users can quickly evaluate any Function Definition simply by editing the values of the variables in the table. The result is evaluated in real time as you change the values of the variables.
With Math Dynamics you can share your function defintions with other users. Export and Import functions allow the Users to save and share any of the Function Defintion's in the Pallet as a Math Dynamics XML file. These files also include the values of the variables, the result and the Trig Mode at the time of Export.
Vibrology uses the Accelerometer Sensor to monitor and record low frequency vibrations and shocks. The App provides real time graphical feedback. The app analyzes discrete snapshots containing 1024 data samples collected incrementally over a period of 1 to 10 seconds depending on the device. The signal analysis produces a Frequency Domain graph (1 to 255) hz from the 1024 Time Domain sample set.
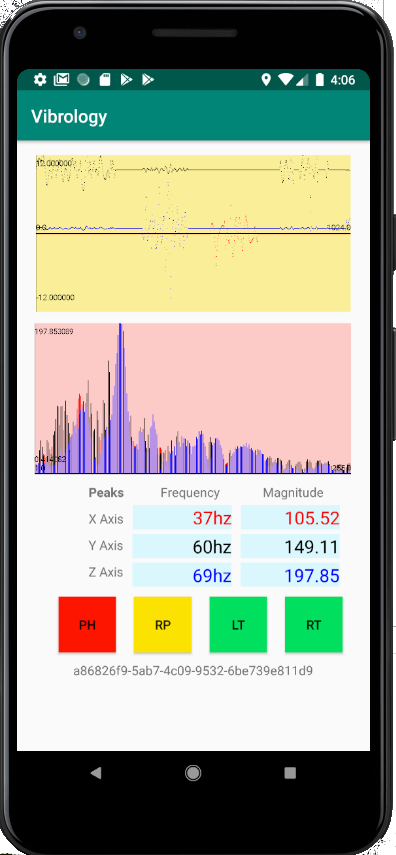
The App has one simple screen with three graphical elements and a set of four buttons. The graphical elements include the Time Domain and the Frequency Domain graphs and a table of Peak Frequency values.
The Button Panel contains four buttons that can be used to flag User Defined Event Types. These event type values are integers from 1 to 4. Red is 1, Yellow is 2, blue is 3 and green is 4.
At the bottom of the screen is the Data Mine Key. Each snapshot includes the vibration and shock data along with the GPS coordinates at the time of the snapshot. Additionally, the The Speed, Date and Time are recorded. Each snapshot is stored in a database at the JamworksPro Data Center. Snapshots can be queried in the Vibrology Data Mine based on this Data Mine Key.
The App displays Time Domain and Frequency Domain graphs for each sample set. The Time Domain shows the plot generated by the 1024 sample of vibration and motion applied to the accelerometer.
The Frequency Domain graph displays the magnitude of each frequency between 1 and 255 hz. The magnitude values are in m/s^2. Acceleration Forces are measured along the X, Y and Z axis' of the device.
The Frequency Domain graph is generated by applying the Time Domain samples to the Fast Fourier Transform. The Peak magnitudes and the associated frequency for each of the three axis' are displayed in a table below the graphs.
The Frequency Domain data for each snapshot is stored in the Vibrology Database at the JamworksPro Data Center.
The Pothole Project is designed to address our collective pothole problems through a passive monitoring system that rates road surfaces and continuously reports them publicly. JamworksPro has developed the Vibrology App for this purpose. The Vibrology App monitors kinetic energy on the x, y and z axis of the device. It takes 1024 snapshots as fast as the device can take them (1 to 10 seconds). The time domain based data snapshots are graphed on one graph while the frequency domain based kinetic histograms (1hz through 255hz) are plotted on another. The second graph is the most useful as it reports the low frequency kinetic forces applied to each of the three axis'. |
The Pothole Project was inspired from the road conditions I encountered in Denver Colorado. The roads there are the poorest I've encountered. And as if the organically formed potholes are not bad enough all the local municipalities create artificial ones with all the recessed manhole covers. Typically inconveniently lined up off center in a tire track. I must admit I bristle everytime I crash through a pothole and feel the violent shock waves killing my tires and suspension. How much can my car take? Who's responsible for all the damage? Aren't all our taxes for public infrastructure supposed to keep this problem in check? At the end of the day the new tires, springs, shocks and struts is on you, the automobile owner. If the people who misappropriate our infrastructure tax dollars aren't able to keep this problem in check then the responsibilty falls into the public domain. If the tax dollars for our infrastructure were properly spent, potholes would be very rare and not ubiquitous. Most municipalities have some form of pothole reporting system. But who's behind those reporting systems? Whoever they may be they fail the taxpayers as a matter of routine. A big reason they fail is that the reporting systems are depenendent upon angrily reported and unreliable complaints from motorists. |